$41.19M in 365 days, up 162%: what a testing system does when the conversion rate barely moves
- Client
- Anonymous DTC store
- Industry
- DTC ecommerce
- Work
- Testing across traffic angles, offers and bundles

One DTC store, kept anonymous, did $41.19M in the last 365 days, up 162% year over year, while its conversion rate slipped 4%. Sessions grew 71% and orders 114%. In my essay I credit the growth to a testing system running across every traffic angle, every offer and every bundle. This case study shows the raw Shopify receipt, tile by tile.
Who is the store?
The store is a DTC ecommerce brand that I keep anonymous. The receipt was shared with client permission and sensitive identifiers are cropped, so I do not name the brand, its category or its team.
It is the same account behind my LinkedIn essay It Was Never a Bad Agency. It Was a Bad Structure., which cites the figure as one account over the trailing 365 days.
What does the essay credit for the growth?
A testing system, run across every traffic angle, every offer and every bundle, month after month. In the essay I put it this way:
The growth did not come from one perfect page. It came from a testing system running across every traffic angle, every offer, every bundle, month after month. The best brands do not own a winning page. They own a winning system.
Hamid Chakir, It Was Never a Bad Agency. It Was a Bad Structure. (LinkedIn, Jul 2026)
A testing system is the CRO loop with no finish line: audit, hypothesize, test, scale, then back to the audit. Each round ranks the next leak by expected revenue impact, and each winner becomes the control the next test has to beat.
The three surfaces in that line mean the following in general terms:
- Traffic angles: the different promises the ads make, each needing a page that matches it.
- Offers: what the buyer is asked to choose, and on what terms.
- Bundles: how units are grouped and framed, which moves order value.
I do not publish which tests ran on this store, what they changed or how the spend moved. The point of this case study is the system, and the receipt that shows what it added up to.
What were the results?
The store did $41.19M in the last 365 days, up 162% year over year, and the conversion rate barely moved. Here is the raw dashboard:
| Tile | Value | Change |
|---|---|---|
| Sessions | 8.73M | +71% |
| Total sales | $41.19M | +162% |
| Orders | 539.1K | +114% |
| Conversion rate | 3.93% | down 4% |
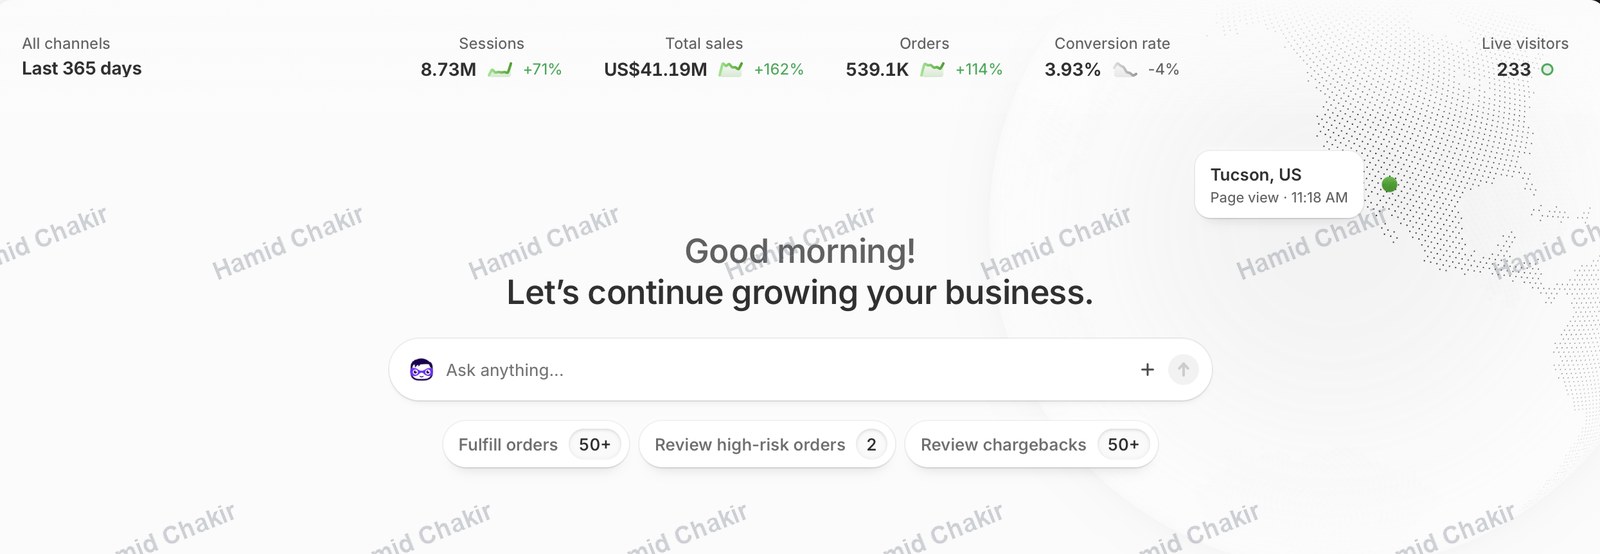
The screenshot is the Shopify home dashboard for all channels over the last 365 days, watermarked, with sensitive identifiers cropped. It sits with the other raw screenshots in the receipts section of my portfolio.
The part that matters most: the conversion rate barely moved.
Hamid Chakir, It Was Never a Bad Agency. It Was a Bad Structure. (LinkedIn, Jul 2026)
How can revenue grow this much with a flat conversion rate?
Revenue is sessions multiplied by conversion rate multiplied by average order value. With conversion rate down 4%, the growth shows up in the other two terms: sessions up 71%, and more revenue per order.
Orders grew faster than sessions (114% against 71%) even though the conversion rate slipped. Shopify counts conversion rate by sessions that end in an order, so orders can outgrow sessions, for example when recurring subscription orders arrive without a new session.
Holding conversion rate close to flat while sessions grow 71% is the part a testing system is for: new traffic angles bring colder visitors, and every offer and bundle has to keep converting them. On a report that tracks conversion rate alone, this year would look flat, while the store grew 162%.
What should a similar brand take from this?
Build a testing system before you go looking for a winning page. Four principles I take from this account:
- Judge the program on revenue. Conversion rate is one input, and a flat rate next to a growing revenue line can be the system doing its job.
- Test across every traffic angle, offer and bundle. Each one is a separate lever on revenue, and a system keeps working all of them.
- Keep the loop running month after month. Step five is step one again: the next leak is already ranked.
- Fix the page the campaign points to. The work almost always opens with a new campaign, when the money is leaking from the page that campaign points to.
After sixty audited accounts, the pattern is almost always the same: the creative is doing its job, and the page is quietly killing the click.
Hamid Chakir, It Was Never a Bad Agency. It Was a Bad Structure. (LinkedIn, Jul 2026)
For the loop in detail, see how I run a CRO testing process. For why revenue per visitor is the better scoreboard, see conversion rate vs revenue per visitor.
FAQ
How can revenue grow 162% if the conversion rate barely moved?
Revenue is sessions multiplied by conversion rate multiplied by average order value. On this dashboard the conversion rate slipped 4% while sessions grew 71%, so the growth came through traffic and order value. In my essay I credit it to a testing system running across every traffic angle, every offer and every bundle, month after month.
Which brand is the $41.19M store?
I keep it anonymous. The screenshot was shared with client permission and sensitive identifiers are cropped. I do not name the brand, its category, its team or its spend, and I do not say what was tested. It is the same account I describe in my LinkedIn essay on agency structure.
What is the difference between a winning page and a winning system?
A winning page is one test result: it beat its control once, on the traffic it saw at the time. A winning system is the loop that keeps producing results: audit, rank leaks by revenue, test against the control, scale the winner, repeat. Traffic, offers and seasons change, and a system keeps finding the next leak as they do.
Can a testing system make up for weak ads?
It works on the other half of the funnel. After sixty audited accounts, the pattern I see is that the creative is usually doing its job and the page is quietly killing the click. A testing system fixes what happens after the click: the page, the offer and the bundle. Good ads get more out of every visit when that half holds up.
Is the $41.19M receipt edited?
It is a raw screenshot of the Shopify dashboard, watermarked with my name and cropped to remove sensitive identifiers. The caption reads "Shopify · $41.19M last 365 days (+162%)". It sits in the receipts section of my portfolio with the other raw screenshots, each shared with client permission.