Conversion rate vs revenue per visitor: how to read an A/B test before you ship it

Read it on the metric that pays you: conversion rate and revenue per visitor side by side, in relative and absolute terms, before anything ships. Conversion rate counts buyers. Revenue per visitor, conversion rate times average order value, counts money, so it is the number to ship on whenever the variant can change what people spend.
Key takeaways
- Revenue per visitor is conversion rate times average order value, so it is the number to ship on whenever a variant can change what people spend.
- Relative lift divides the change by the control's rate: 1.18% to 5.88% is captioned +400%, and the absolute difference is 4.70 points.
- Two receipts with nearly the same relative lift, +66% and +64.3%, added 1.34 and 0.75 points: the base rate changes what a percentage means.
- Natural Rems moved conversion rate +40% and average order +25%; a read on conversion rate alone would report only one of the two.
- The portfolio receipts are anonymous: brand, change, duration and sample size are not published, so this guide does not judge their significance.
What is the difference between conversion rate and revenue per visitor?
Conversion rate counts buyers; revenue per visitor counts money. Conversion rate is the share of visitors who place an order, and revenue per visitor is the revenue a page earns for every visitor who lands on it, whether they buy or not.
Revenue per visitor equals conversion rate times average order value. So a variant that wins more buyers at a smaller order can earn less per visitor, and a variant that wins fewer buyers at a bigger order can earn more.
| Metric | What it counts | How to calculate it | What it misses |
|---|---|---|---|
| Conversion rate | Buyers | Orders divided by visitors | What each buyer spends |
| Average order value | Order size | Revenue divided by orders | How many visitors buy |
| Revenue per visitor | Money per visitor | Revenue divided by visitors, or conversion rate times average order value | Little, though a few large orders can swing it on a small sample |
What do real A/B test results look like?
Like the A/B test receipts on my portfolio: raw, watermarked screenshots of a control against a variant, each captioned with its lift. They cover four tests, and the first one appears twice, once for conversion rate and once for revenue per visitor. The table lists them with the absolute difference added.
| Test | Metric | Control | Variant | Lift (as captioned) | Absolute difference |
|---|---|---|---|---|---|
| Test 1 | Conversion rate | 1.18% | 5.88% | +400% | 4.70 points |
| Test 1 | Revenue per visitor | $0.25 | $1.22 | +389% | $0.97 more per visitor |
| Test 2 | Conversion rate | 1.79% | 3.33% | +86.7% | 1.54 points |
| Test 3 | Conversion rate | 2.03% | 3.37% | +66% | 1.34 points |
| Test 4 | Conversion rate | 1.16% | 1.91% | +64.3% | 0.75 points |
The receipts are anonymous. The brand, the change being tested, how long each test ran and the sample size are not published, so this guide does not judge their statistical significance. It uses them only to show how to read the numbers.
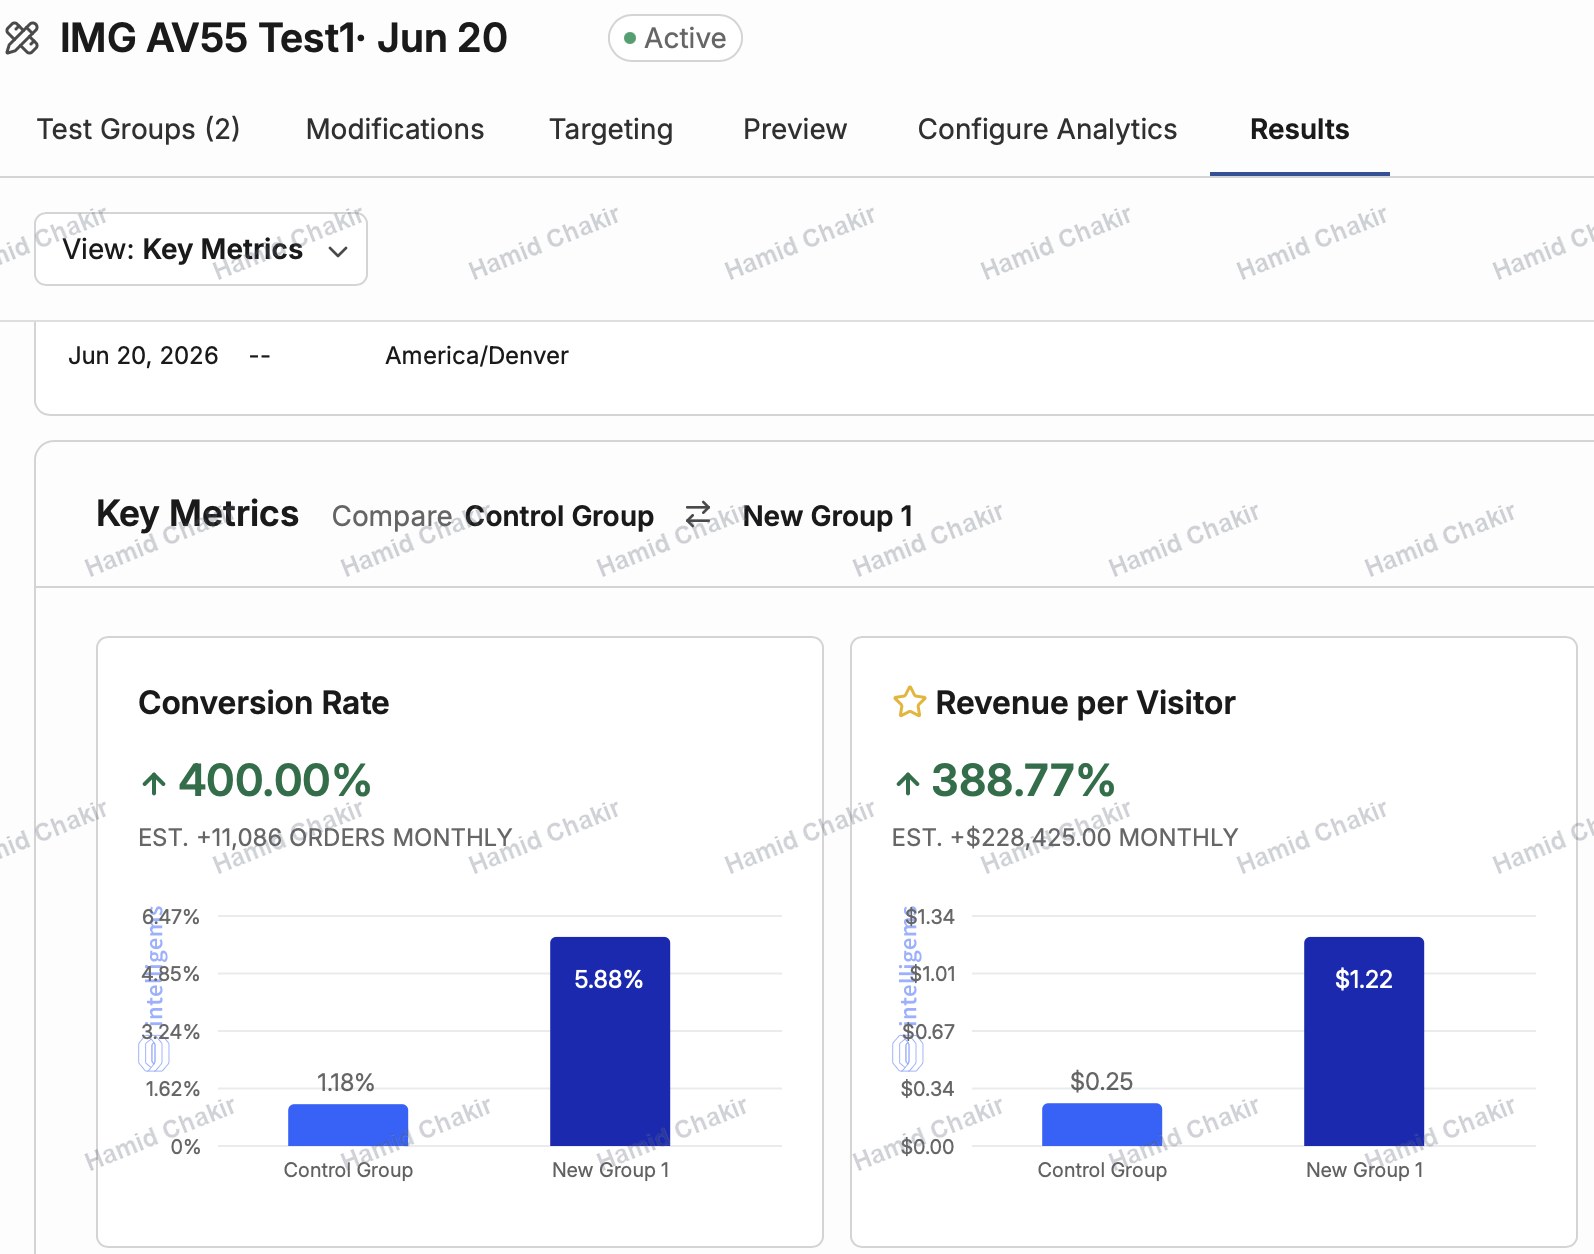
This screenshot is test 1: a conversion rate card next to a revenue per visitor card, control group against new group. That is how I read every result, both numbers side by side. All the receipts, including the store dashboards, are on the portfolio under receipts.
What is the difference between relative and absolute lift?
Relative lift is the change divided by the control's rate; absolute lift is the plain difference between the two rates, in percentage points. Read both, because they answer different questions.
On the first receipt, conversion rate went from 1.18% to 5.88%. The caption shows the relative lift, +400%, which means the variant converted at five times the control's rate. The absolute difference is 4.70 points.
One point of conversion rate is one more buyer for every hundred visitors. Absolute points tell you how many more orders the same traffic produces; relative lift tells you how strong the change was against its own baseline.
The base rate changes how a percentage reads. The third and fourth receipts carry nearly the same relative lift, +66% and +64.3%, but the third added 1.34 points (2.03% to 3.37%) and the fourth added 0.75 points (1.16% to 1.91%).
Why ship on revenue per visitor instead of conversion rate?
Because revenue per visitor counts money, and it catches changes in order value that conversion rate cannot see. Whenever a variant can change what people spend, revenue per visitor is the number I ship on.
Offer architecture, bundles and subscription flows are part of the scope I test, and each of them can move order value as well as conversion rate. A conversion rate win can hide a smaller average order, and an order value win can hide inside a flat conversion rate.
The Natural Rems ledger shows both levers moving: conversion rate +40% and average order +25%, from a full funnel rebuild of the PDP, offer architecture and post-click flow. Revenue per visitor multiplies the two, so it captures both; a read on conversion rate alone reports only one of them.
The Serene Herbs ledger has the same shape: conversion rate +30% and average order +20%. Both are brand-level results for the whole program, not for a single test.
Test 1 shows both readings on one result. Conversion rate went from 1.18% to 5.88% (+400%) and revenue per visitor from $0.25 to $1.22 (+389%), so each visitor was worth $0.97 more. Revenue per visitor grew slightly less than conversion rate, which means the average order in the variant was a little smaller. At capture, the variant's revenue per visitor was almost five times the control's. The test was still marked active, so this is a reading of the numbers, not a verdict.
Paid traffic is bought click by click, so revenue per visitor is the number that sits directly against what each click costs.
Conversion rate is a fair primary metric when the variant cannot touch order value: same offer, same price, same bundles, and the only question is whether more people buy. Even then, I read revenue per visitor as a check.
What should you check before you ship an A/B test winner?
Five checks, in this order. They take little time and catch the common ways a test result misleads.
- Pick the primary metric first. Decide before the test starts whether it ships on conversion rate or revenue per visitor. Choosing after the results come in lets you pick whichever number happens to look good.
- Check the control is the real control. The control should be the page as it runs today, with the same offer, price and traffic sources as the variant. A stale or broken control makes any variant look like a winner.
- Read both rate and revenue. Put conversion rate and revenue per visitor side by side. If they point in different directions, average order value moved, and the revenue number decides.
- Watch for rounding. Quote lifts as the tool reports them and show the rates beside them. A lift recomputed from rounded rates comes out slightly different and starts a needless argument.
- Know what changed. Write down exactly what differs between control and variant. If you cannot name the change, you cannot roll it out sitewide or learn from it in the next round.
Statistical significance and sample size belong on the list too, and most testing tools report them. The portfolio receipts do not publish them, which is why this guide reads those receipts for method only.
Where does reading a test result fit in a CRO program?
It is the gate between testing and scaling. A result that passes the checklist becomes a verified winner and rolls out sitewide; one that fails goes back to the backlog, and the next test on the list runs.
Winners have numbers. Opinions do not ship. The four steps around this gate are in how a CRO testing program runs.
FAQ
Can conversion rate go up while revenue per visitor goes down?
Yes. If a variant wins more buyers at a smaller average order, for example by steering people to a single unit instead of a bundle, conversion rate rises while revenue per visitor can stay flat or fall. That is why I read both numbers and ship on revenue per visitor whenever the offer is part of the change.
How do you calculate revenue per visitor?
Divide the revenue a page or variant earned by the number of visitors it received. The same number comes from multiplying conversion rate by average order value. Visitors who did not buy stay in the count, which is the point: it measures what each visitor you paid for is worth to the store.
Why do low conversion rates produce such large percentage lifts?
Because relative lift divides by the control's rate, and a small base turns a modest gain into a big percentage. On the portfolio receipts, 1.16% to 1.91% is captioned +64.3%, yet it is 0.75 points in absolute terms. Quote the absolute points next to the percentage so the size of the win is clear.
Why does my recalculated lift not match the testing tool?
Because the tool computes the lift from unrounded data and displays rounded rates. Recompute from the rounded rates and you get a slightly different number. Quote the lift the tool reports, show the rates beside it, and spend the time on the decision instead of on a decimal that comes from rounding.
What is a good revenue per visitor for a DTC store?
There is no single good number, because it depends on price point, order value and where the traffic comes from. The useful comparisons are your variant against your control on the same traffic at the same time, and your revenue per visitor against what each visitor costs you in ads.